


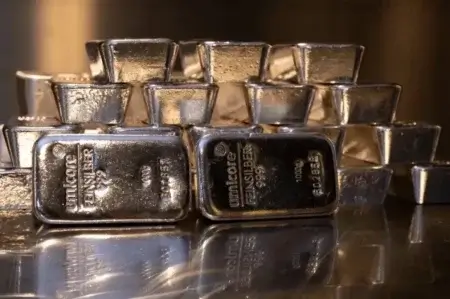
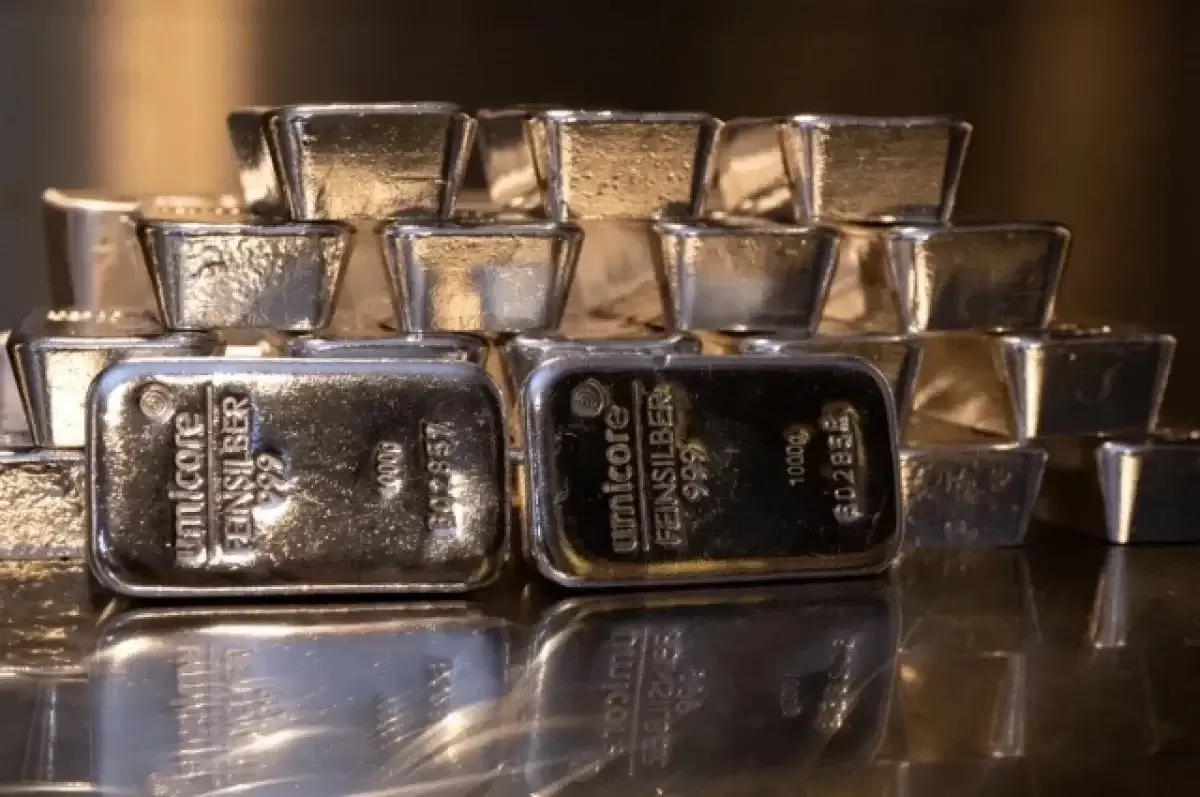
For the first time, silver prices crossed $80. Why could this be a bearish sign?
As the XAG/USD chart shows, the price of an ounce of silver reached $83 this morning for the first time in history, but was followed by an unusually strong downward move.
Why did the price of silver fall?
On December 24th, we not only described the fundamentals, but also pointed out that the market is vulnerable to strong price movements due to reduced liquidity during the holidays.
Now that the ATR indicator has risen sharply and confirmed our assumption, let's look at the important details on the chart that reflect bearish signs
Technical analysis of the XAG/USD chart
The previously constructed ascending channel (shown in orange) maintained the tilt angle while:
→ The rise in silver prices on December 26 (represented by the arrow) with a bullish gap extended the channel up by 2x.
→ At the beginning of today's trading, the price broke into the zone above the upper boundary with another bullish gap (represented by the second arrow).

It is important to note that:
→ A sharp rise in silver prices to historic highs may have been triggered by a lack of liquidity among sellers as financial markets opened in the final week of the year.
→ The aggressive nature of the subsequent decline to $75 appears to be a clear sign of a change in market sentiment.
→ Wide candles indicate the activity of “smart money”.
Given the above, it is reasonable to assume that large long positions are busy taking profits after the price of silver has risen by around 160% since the beginning of 2025. If this hypothesis is correct, we could see a breakdown of the lower boundary of the constructed orange channel and a subsequent decline that could occur in the first few days of 2026.
Other articles
Trading Signal Filters: Main Volume Indicators in Crypto Trading
Most trading indicators are formed solely on the basis of prices.But there is a separate group of

Gold will shine in a bad year for commodities – ING
US-China tensions could weigh on energy and commodities markets next year, while the outlook for

Analysts at BitMEX predict an increase in the price of Bitcoin to $200,000 in the first quarter of next year.
Where is Bitcoin heading in 2026?Crypto professionals give forecasts and show which aspects are

Japanese candlestick analysis.Candlestick chart analysis
The most convenient charting option for any asset on Forex is Japanese candlesticks.The